

How Quantities Combine: Understanding Data
Never average the averages — the bigger group pulls the combined result towards itself, and every chart deserves a second look at its scale.
Original notes — ready CBSE (NCERT, English Medium) • Class 9 • Mathematics • Book: Ganita Manjari — Part 2
Chapter 10: How Quantities Combine: Understanding Data — EG's own notes, in simple words
Book: Ganita Manjari — Part 2 (CBSE, Class 9) | Chapter 10 | Medium: English
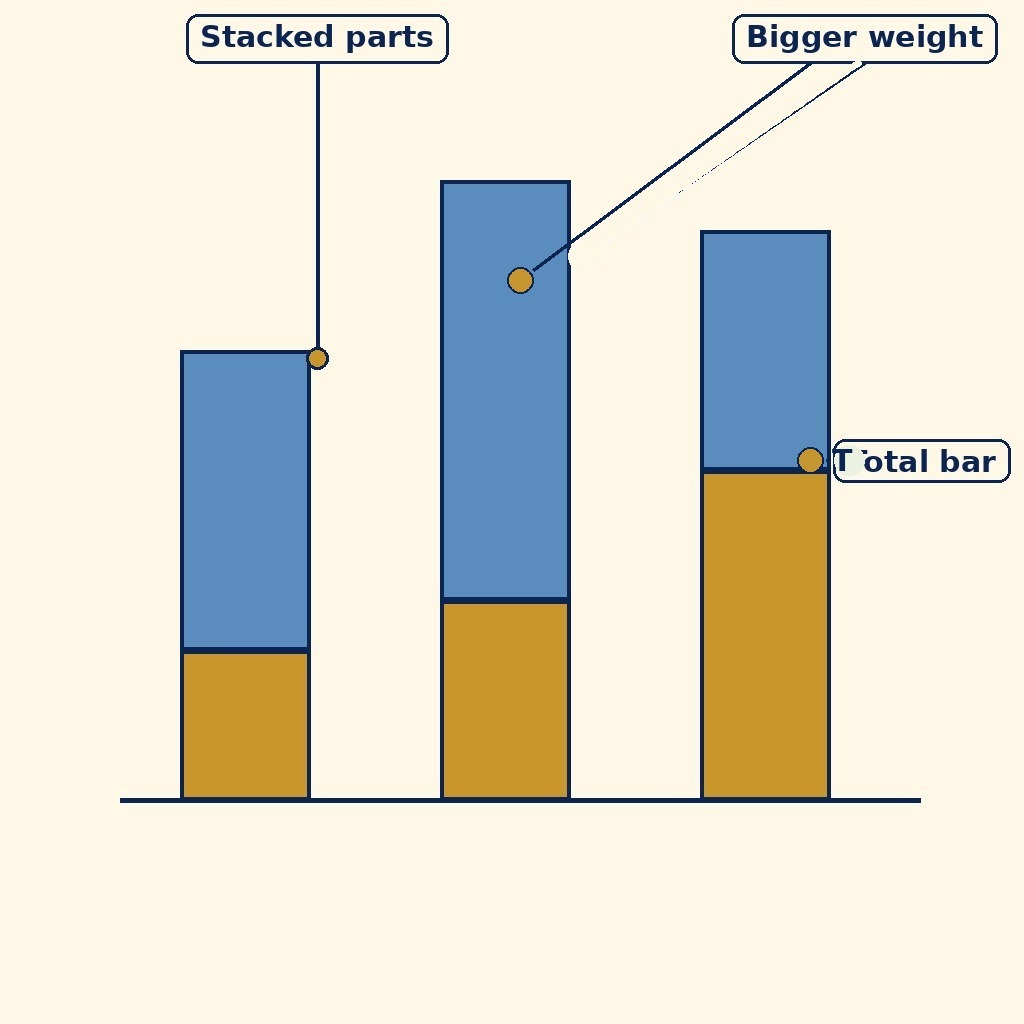
Diagram (labels are printed on the image): A bar chart with bars of different heights, split into two coloured parts each, showing how totals combine from weighted parts.

Mixing two quantities — the combined result depends on how much of each goes in.
What the chapter is about
Averages can mislead. If Class A has 10 students averaging 80 marks and Class B has 40 students averaging 60 marks, the combined average is not 70 — the bigger class pulls the average more strongly towards its own score. This chapter is about how quantities combine: weighted averages, where each value counts according to its weight, and mixtures, where two quantities blend in proportion.
You will also learn to read and question charts. A stacked bar chart shows how a whole is shared between parts, and a 100% stacked bar lets you compare shares even when the totals differ. But charts can hide as much as they show — a bar chart with a cut-off axis can make a small difference look huge, so always read the scale before believing the picture.
The habit this chapter builds is suspicion in a good sense: before trusting a number, ask who was counted, how much each group weighed, and what the chart is not showing.
Mixtures work the same way as weighted means, and the chapter shows it with jaggery. Mix a solution that is 10% jaggery with one that is 20% jaggery, and the mixture's concentration lands between the two — closer to the one you used more of. With equal quantities it sits exactly midway at 15%; with more of the weaker mixture, it sits below midway. Concentration is just quantity of the part divided by quantity of the whole, and the mixture's concentration is the weighted mean of the two concentrations, weighted by quantities.
The chapter also gives each group its own custom weight. A teacher might count a test at 60% and homework at 40%: a student scoring 80 on the test and 90 on homework gets 0.6 × 80 + 0.4 × 90 = 84, not the plain mean 85. And when charts are compared, the chapter prefers the 100% stacked bar over a pie chart when totals differ: because every bar is scaled to 100%, shares can be compared honestly even when the groups are of very different sizes.
What you should learn
- Compute weighted means, understand mixtures, and read stacked bar charts critically.
- Find a mixture's concentration as a weighted mean of its parts' concentrations.
- Apply custom weights, such as 60% test and 40% homework.
- Compare shares with 100% stacked bars when totals differ, and always check a chart's scale.
Key Terms
- Mean — The sum of values divided by the number of values.
- Weighted mean — A mean in which each value is multiplied by its weight before averaging, so bigger groups count more.
- Mixture — A combination of two or more quantities in a stated proportion, such as two solutions mixed together.
- Stacked bar chart — A bar chart in which each bar is divided into parts showing how a total is shared.
- 100% stacked bar — A stacked bar chart in which every bar is scaled to the same total, so shares can be compared.
- Concentration — In a mixture, the quantity of one part divided by the quantity of the whole, often as a percentage — for example, jaggery as a percentage of a solution.
- Custom weights — Weights chosen for a purpose rather than by group size, such as counting a test at 60% and homework at 40% in a final score.
Remember
- Combined average = (sum of all values) ÷ (total number of values) — never just average the averages.
- Weighted mean = (w₁x₁ + w₂x₂ + …) ÷ (w₁ + w₂ + …).
- In a 100% stacked bar, each bar represents 100% of its own total.
- Always check a chart's scale and labels before drawing conclusions.
- A mixture's concentration always lies between the concentrations of its parts.
- Custom weights must add to the whole: 60% + 40% = 100%, or the mean is meaningless.
Exam Tip / Common Mistake
Common mistake: averaging two class averages directly. Weight each average by its class size first — the bigger class counts more.
Chart / Table: Combining averages: the right way
| Point | Detail |
|---|---|
| Class A: 10 students, mean 80 | Total marks = 10 × 80 = 800 |
| Class B: 40 students, mean 60 | Total marks = 40 × 60 = 2400 |
| Wrong method | (80 + 60)/2 = 70 — ignores class sizes |
| Right method | (800 + 2400)/50 = 64 — the true combined mean |
| Lesson | Bigger groups pull the combined mean towards themselves |
Worked method: a weighted mean with custom weights
- A student scores 80 on a test (weight 60%) and 90 on homework (weight 40%).
- Multiply each score by its weight: 0.6 × 80 = 48 and 0.4 × 90 = 36.
- Add: 48 + 36 = 84. The final score is 84 — not the plain mean 85, because the test counts more.
Practice set — try it yourself
- Class A has 20 students averaging 75; Class B has 30 students averaging 85. Find the combined mean.
Hint: Hint: Find total marks first, then divide by 50. - A shop mixes 3 kg of tea at ₹400/kg with 2 kg at ₹550/kg. Find the mean price per kg.
Hint: Hint: Weight each price by its quantity. - In a 100% stacked bar, a bar shows 60% girls and 40% boys. If the class has 50 students, how many girls?
Hint: Hint: 60% of 50. - A chart's vertical axis starts at 50 instead of 0. Why can this mislead?
Hint: Hint: Think about how bar lengths compare. - Two mixtures are 1:2 and 2:1 of the same ingredients. Are they the same? Explain.
Hint: Hint: Compare the shares of each ingredient.
Questions with Answers
- What is a weighted mean?
A weighted mean gives each value an importance, or weight, and averages accordingly: multiply each value by its weight, add, and divide by the total weight. - Class A: 10 students, mean 80. Class B: 40 students, mean 60. What is the combined mean?
Total marks = 800 + 2400 = 3200, total students = 50, so combined mean = 3200/50 = 64. - What does a 100% stacked bar chart show?
It shows how each total is shared between its parts as percentages. Because every bar is 100%, shares can be compared even when the totals are different. - Why is averaging two averages usually wrong?
Because it treats both groups as equal in size. Unless the groups are the same size, the larger group must count more, which only the weighted mean does. - A bar chart makes a rise from 51 to 52 look enormous. What is probably wrong?
The vertical axis probably does not start at zero, so a tiny difference looks like a huge bar-length difference. Always check the axis.
Extension questions
- Mix 2 kg of a 10% jaggery solution with 3 kg of a 20% solution. Find the mixture's concentration.
Jaggery = 0.2 + 0.6 = 0.8 kg in 5 kg, so concentration = 0.8/5 = 16%. - A test counts 60% and homework 40%. A student scores 70 on the test and 95 on homework. Find the final score.
0.6 × 70 + 0.4 × 95 = 42 + 38 = 80. - Three classes have 10 students averaging 70, 20 averaging 80 and 30 averaging 90. Find the combined mean.
Totals: 700 + 1600 + 2700 = 5000 marks over 60 students: 5000/60 ≈ 83.33. - A 100% stacked bar shows 55% girls in a class of 40. How many girls are there?
55% of 40 = 22 girls. - Why is a 100% stacked bar better than a pie chart when comparing groups of different sizes?
Because every bar is scaled to 100%, shares compare honestly even when the totals differ; pie slices from different totals cannot be compared directly. - A chart's bars start at 50, not 0, and one bar looks twice as tall as another. What is wrong?
The cut-off axis exaggerates the difference: bar lengths no longer match the values. Always check where the axis starts.
Weight before you average, whether the weights are group sizes, mixture quantities or a teacher's 60-40 split — and never trust a chart before you have read its scale.
How to use this page: Read the summary, say the Key Terms in your own words, then try the practice set without looking. Use the Questions with Answers to check yourself afterwards. Ask your teacher or parent to check your answers.